
I’ve been playing with auto crash data from NHTSA again. The image below identifies every fatal crash in 2016 by make of the vehicle(s) involved. Click on the image to see it full size in good resolution.
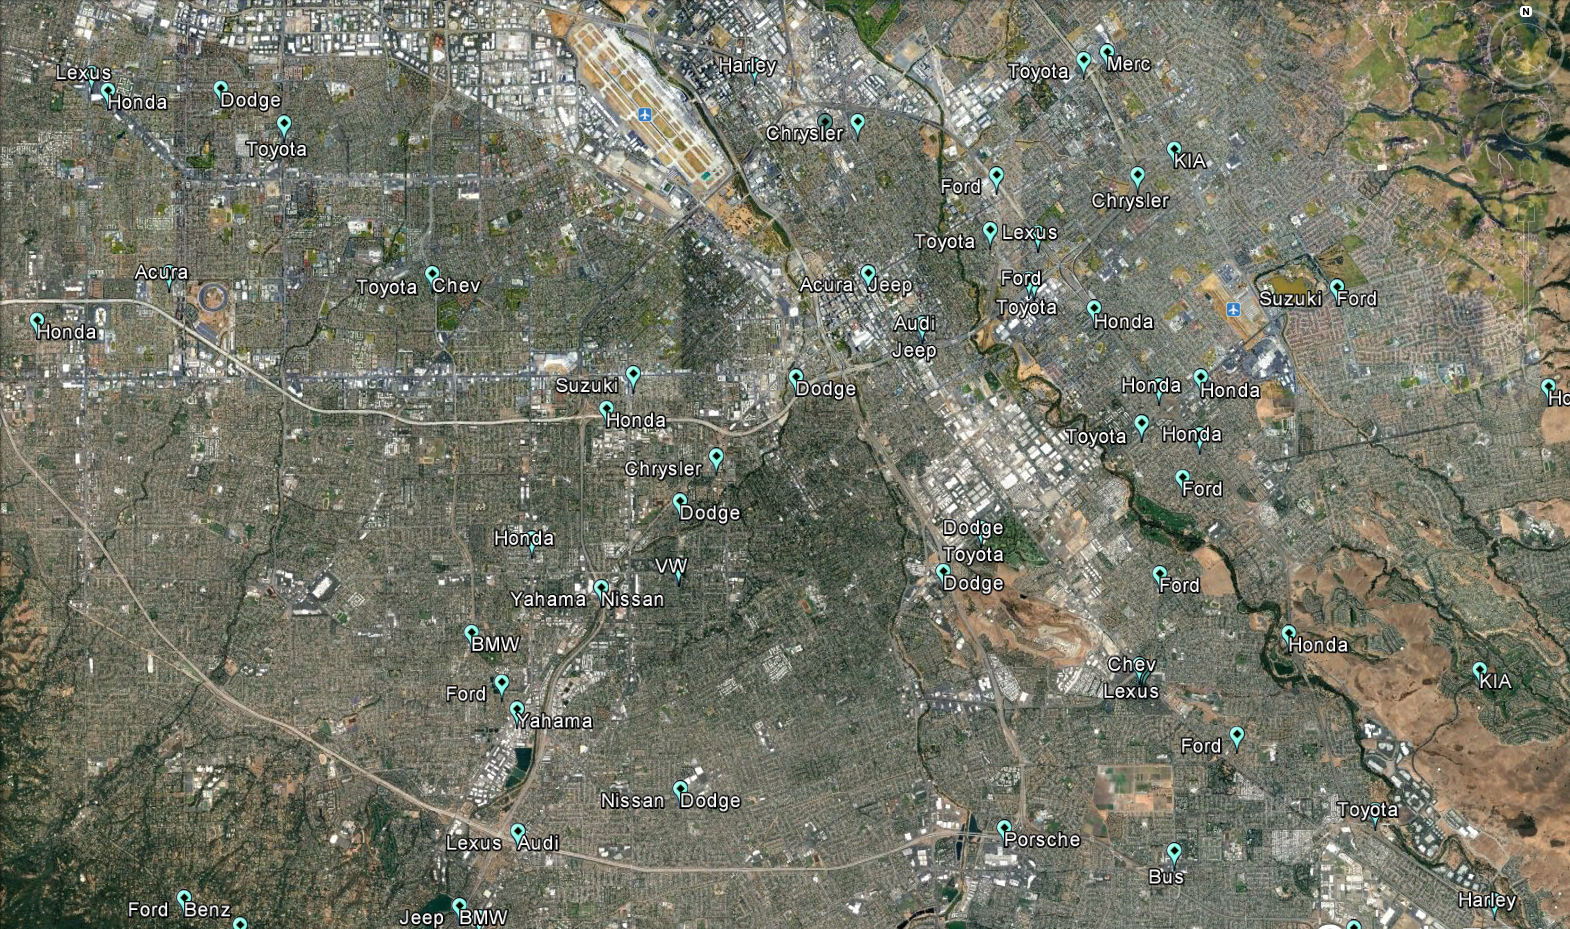
I find it interesting in several ways. First, I notice the makes seem to cluster a bit. The expensive makes tend to locate around Los Gatos, an expensive area, so not too surprising, but overall luxury brands seem to be underrepresented based on my experience seeing what’s on the road. In other words, they seem to be involved in fewer fatal crashes than expected based on numbers on the road. This may be because they are safer vehicles, because the owners drive more safely, or even because they are stolen less often than other makes.
Second, Fords and Hondas cluster around the east side of the valley, Dodges and Jeeps in the central area near downtown. This may be coincidence or perhaps it has to do with dealerships. Most notable, though, to me is the high number in East San Jose on city streets, not freeways. This coincides with crime reports. That area tends to have a lot of bars and violent incidents involving drinking or drugs, although I don’t have hard numbers on that. For those not familiar with the area, the hills to the west are the more expensive areas to live, the east side more working class, although homes get more expensive again up in the eastern hills.
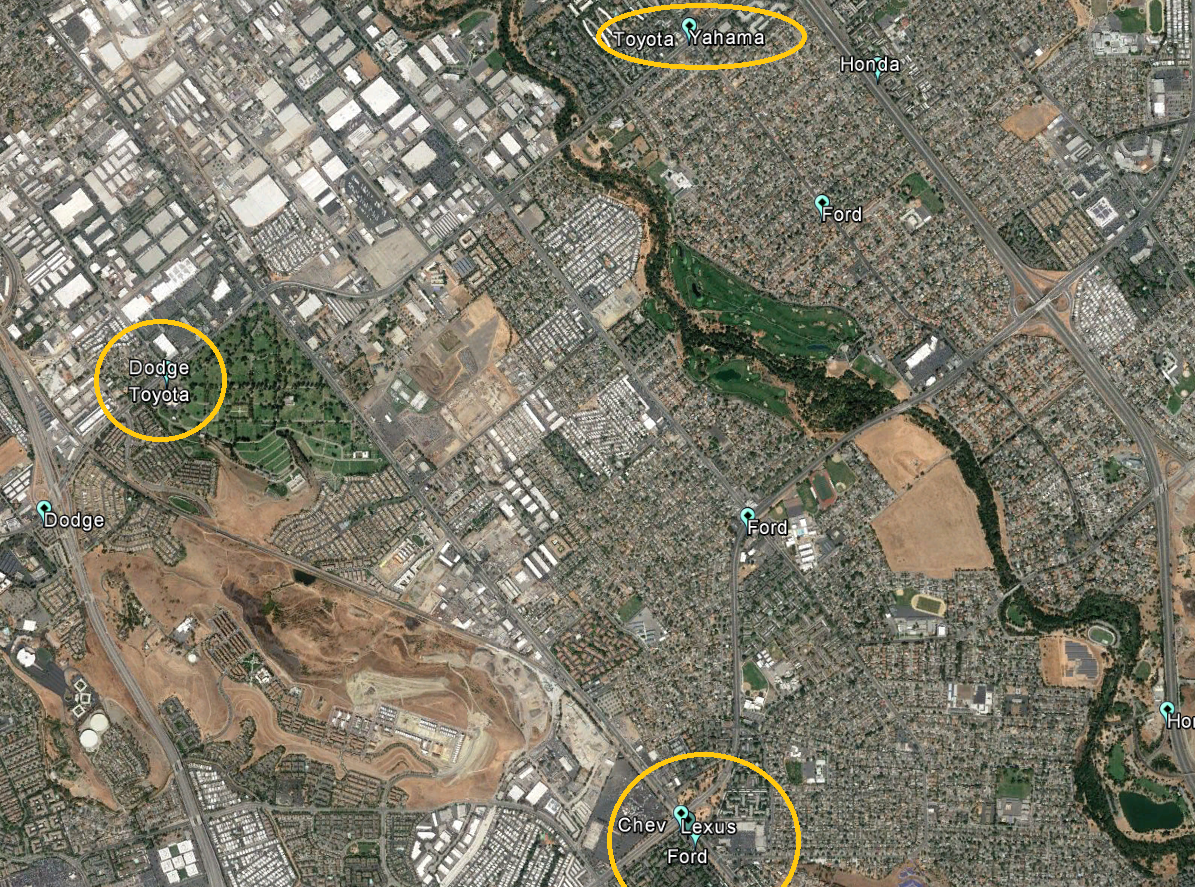
I was also surprised at how many were solo crashes, especially in East San Jose. I suspect drunk driving was involved in a lot of those. You can see some data points with two car makes listed next to them, but they are hard to spot. I created a KML file and loaded it into Google Earth for this. It was an interesting technical exercise, and if you want to know how to do it, contact me using the contact link above. This file allows the user to zoom in on Google Earth and see the crash marker in more detail. Sometimes more vehicles pop out that way. See the image below; I circled a few examples. I only loaded car makes into the data file, but it is possible to include other data in the KML file as long as it can be represented in an Excel file. For example, it might be interested to show this data marked with time of day.
Bear in mind that just because a car was involved in a fatal accident, it doesn’t mean anyone in that car died. Sometimes the death was a pedestrian or bicyclist or in a multi-car crash only one car had a fatality. This map does not show cause or fault, either.